If you have followed all the previous steps, you are almost done. The last part is to create the dashboard for you ruuvi data. This will be fun. I have similar instructions in another post, streaming dataset for lazy people.
Do the following:
- Go to Power BI and create a new dashboard.
- Give a name for your dashboard.
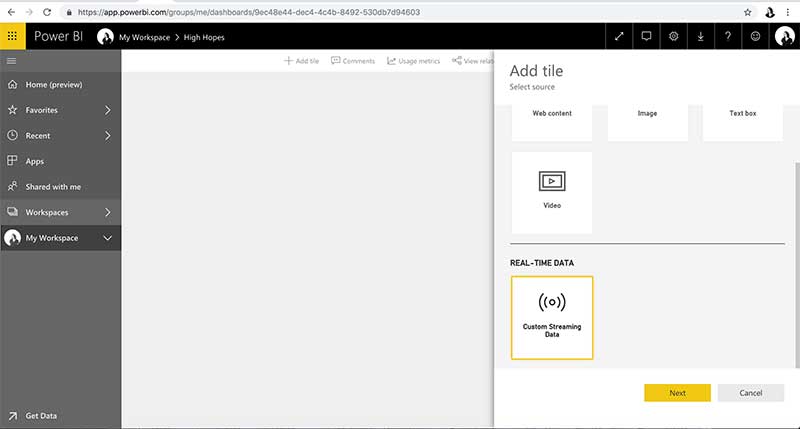
- Add new tile (navigation bar) and choose streaming dataset.
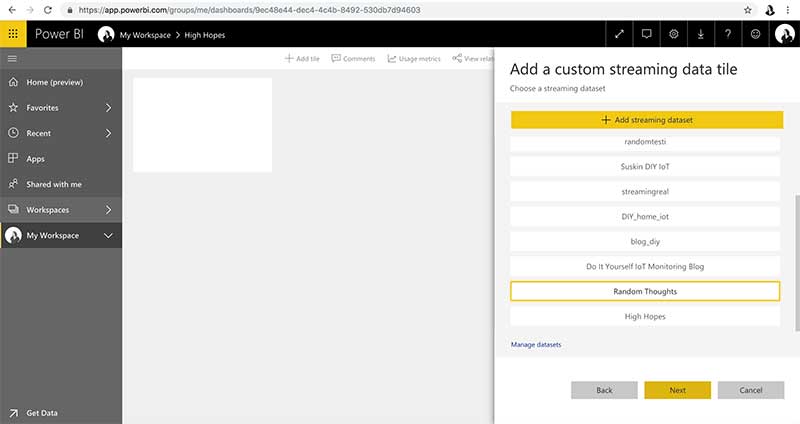
- Choose your dataset, the one you created earlier. Click Next.
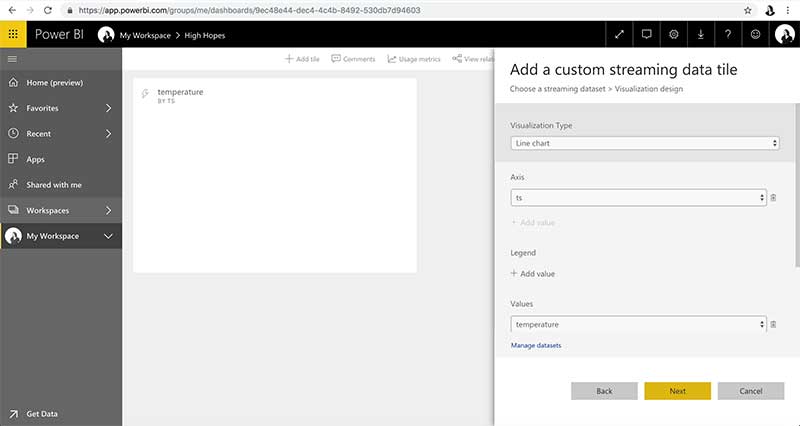
- Choose the type of graph you want to create and fill in the values. Axis is meant for timestamp (ts) and values are the ones you are receiving from ruuvi’s via REST.
- Click Next.
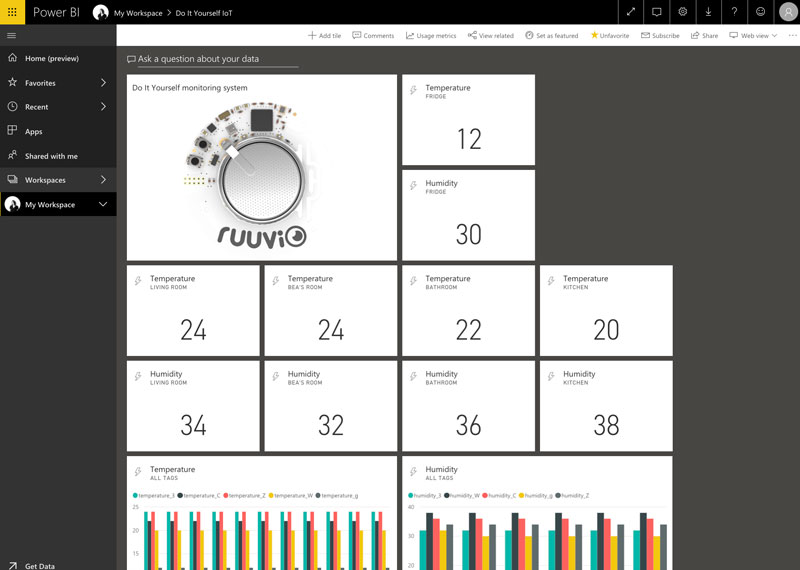
That’s it. Now go ahead and create another tile. Note, that you can create a separate dashboard for mobile phones.
Here’s my dashboard.
Let me know, how did it go with your dashboard!